News analysis · NHANES 2003–08 versus 2021–23
Older Americans Reported Much Bigger Cereal Portions
Ready-to-eat cereal portions rose most clearly among people aged 60 and older. Children’s portions barely moved, while estimates for teenagers and younger adults came with much wider uncertainty.
Finding: among people aged 60 and older, the survey-weighted mean ready-to-eat cereal portion increased from 43.3g in pooled 2003–08 to 54.3g in 2021–23. The 11.0g difference has an approximate design-based 95% confidence interval of 7.1g to 14.9g.
The age split changes the story
Across everybody aged 4 or older, our earlier analysis found that the mean reported cereal portion rose from 48.8g to 53.9g. Breaking that result into age groups shows that the national average does not describe one common shift.
For children aged 4–12, the mean was virtually unchanged: 38.7g became 39.0g. The largest and clearest movement was at the other end of the age range. Among people aged 60 and older, the mean rose by 25.5%, and the weighted median moved from 39.3g to 45.0g.
Point estimates also rose for teenagers and adults aged 20–59, but those comparisons are less precise. In 2021–23, the analysis includes 121 cereal reporters aged 13–19 and 140 aged 20–39. Their wide confidence intervals do not support a firm claim that the underlying mean changed.
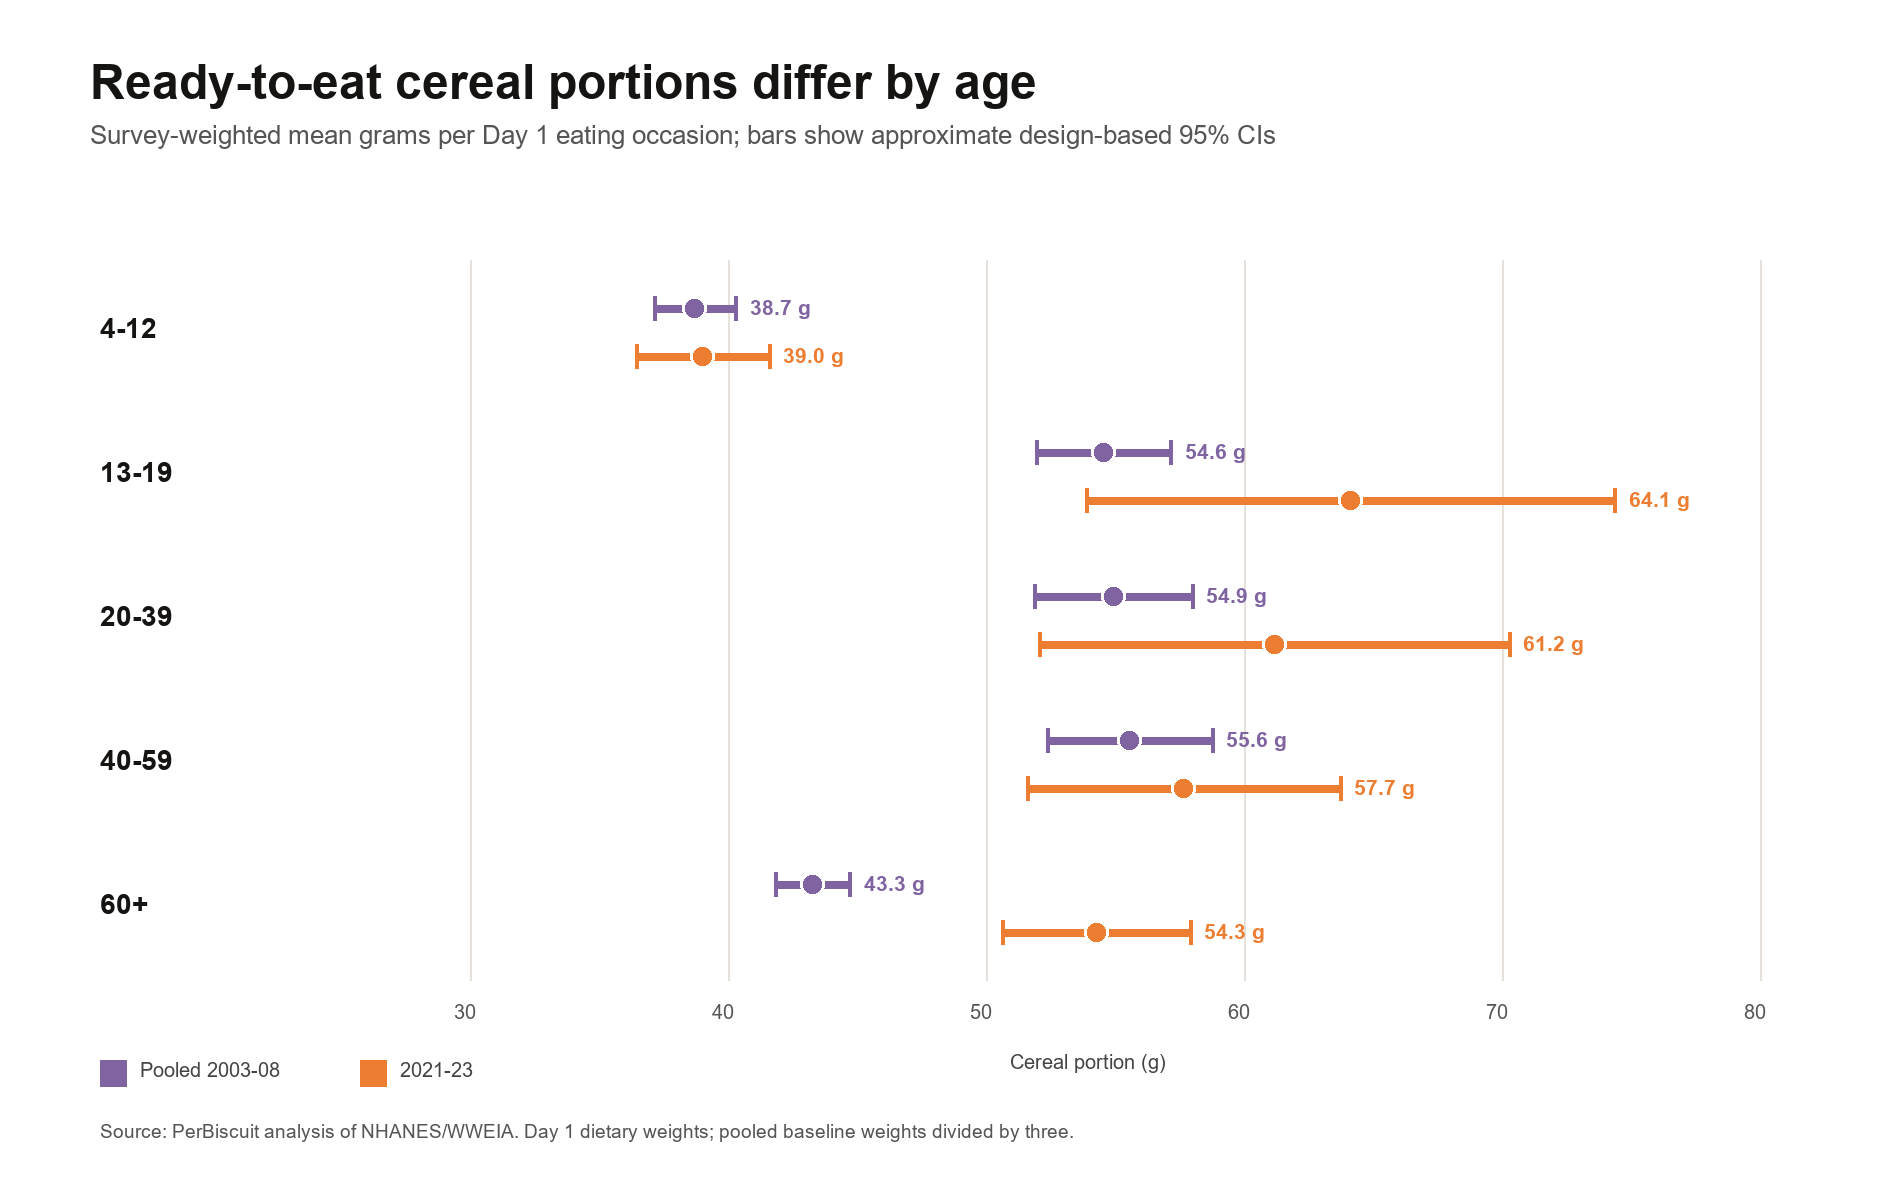
Results by age
Counts are unweighted. “People” counts unique respondents with at least one included cereal occasion; “occasions” counts the eating occasions after cereal records reported at the same time were combined. Values in parentheses are approximate 95% confidence intervals.
| Age | Period | People | Occasions | Weighted median, g (95% CI) | Weighted mean, g (95% CI) |
|---|---|---|---|---|---|
| 4–12 | 2003–08 | 2,069 | 2,265 | 32.8 (31.9–34.1) | 38.7 (37.1–40.3) |
| 2021–23 | 302 | 321 | 30.6 (30.0–35.0) | 39.0 (36.5–41.6) | |
| 13–19 | 2003–08 | 1,219 | 1,293 | 46.1 (43.6–52.5) | 54.6 (51.9–57.2) |
| 2021–23 | 121 | 132 | 45.9 (40.0–60.0) | 64.1 (53.9–74.4) | |
| 20–39 | 2003–08 | 969 | 1,029 | 45.7 (43.0–49.0) | 54.9 (51.9–58.0) |
| 2021–23 | 140 | 144 | 50.2 (40.0–55.0) | 61.2 (52.1–70.3) | |
| 40–59 | 2003–08 | 716 | 745 | 46.5 (42.6–52.5) | 55.6 (52.4–58.8) |
| 2021–23 | 179 | 188 | 50.0 (42.5–59.1) | 57.7 (51.6–63.7) | |
| 60+ | 2003–08 | 1,307 | 1,340 | 39.3 (36.8–40.0) | 43.3 (41.8–44.7) |
| 2021–23 | 459 | 471 | 45.0 (40.0–50.0) | 54.3 (50.6–57.9) |
What changed—and what remains uncertain
| Age | Change in weighted mean | Approximate 95% CI for change | Reading |
|---|---|---|---|
| 4–12 | +0.3g | −2.7g to +3.3g | No clear change |
| 13–19 | +9.6g | −1.0g to +20.1g | Higher point estimate; imprecise |
| 20–39 | +6.2g | −3.4g to +15.8g | Higher point estimate; imprecise |
| 40–59 | +2.1g | −4.8g to +8.9g | No clear change |
| 60+ | +11.0g | +7.1g to +14.9g | Clear increase in this comparison |
The change intervals combine the two periods’ design-based mean standard errors and treat the separate survey periods as independent. They are descriptive comparisons, not age-adjusted models and not corrections for multiple comparisons.
How we made the estimates
- Food definition: ready-to-eat cereal in stable FNDDS food-code families 571–574, plus one 2021–23 code whose full description explicitly identifies ready-to-eat cereal. Ambiguous cereal-not-further-specified and cooked-cereal records were excluded.
- Eating occasion: included cereal food records were summed within each respondent and reported eating time. Milk, fruit, yogurt and other additions were not included.
- Eligibility: age 4 or older, reliable Day 1 recall, positive Day 1 dietary weight and positive cereal gram amount.
- Weights: WTDRD1 was used. For pooled 2003–08, each two-year cycle’s weight was divided by three.
- Survey design: masked strata and primary sampling units were retained for domain estimation. Mean standard errors use Taylor linearization; median intervals use an approximate Woodruff method with the Taylor-linearized variance of the weighted distribution function.
- Rounding: displayed estimates are rounded to one decimal place; calculations use unrounded values.
Why 2021–23 is the newest comparison
August 2021–August 2023 is the newest public NHANES dietary release. Its Individual Foods file provides one record per reported food or beverage, including the gram amount, eating time and FNDDS food code. The Day 1 recall was collected by telephone in this cycle rather than in person at the mobile examination center, so differences can reflect both real behavior and changes in collection conditions.
NHANES guidance says dietary analyses intended to represent the US civilian noninstitutionalized population should use the appropriate dietary weight and account for the complex survey design. We followed that guidance, but this remains a comparison of cross-sectional 24-hour recalls—not a measure of the same people over time.
What the figures do not show
These estimates describe grams of qualifying cereal per reported eating occasion among cereal occasions. They do not estimate usual intake, the percentage of people who eat cereal, cereal plus milk, or a recommended portion. Respondents can contribute more than one occasion, and people who reported no qualifying cereal do not appear in the occasion distribution.
The age pattern does not explain why older adults’ reported portions rose. Product mix, cereal density, bowl size, household composition, reporting behavior and the telephone collection mode may all matter. The result also cannot establish that a Nutrition Facts serving or an FDA reference amount is incorrect for a particular product.
Data and primary sources
Download the complete age-group summary, including standard errors, design degrees of freedom and method fields, or read the broader cereal portion analysis.
Primary documentation: NHANES 2021–23 Day 1 Individual Foods documentation, 2021–23 dietary data release, NHANES dietary analysis tutorial, NHANES weighting tutorial and FNDDS 2021–23 documentation.
Evidence was checked on July 29, 2026. Independent statistical review remains pending. Please use the corrections process to flag a classification, calculation or interpretation issue.