NHANES evidence · 2003–08 versus 2021–23
Breakfast Cereal Portions: What NHANES Shows Changed
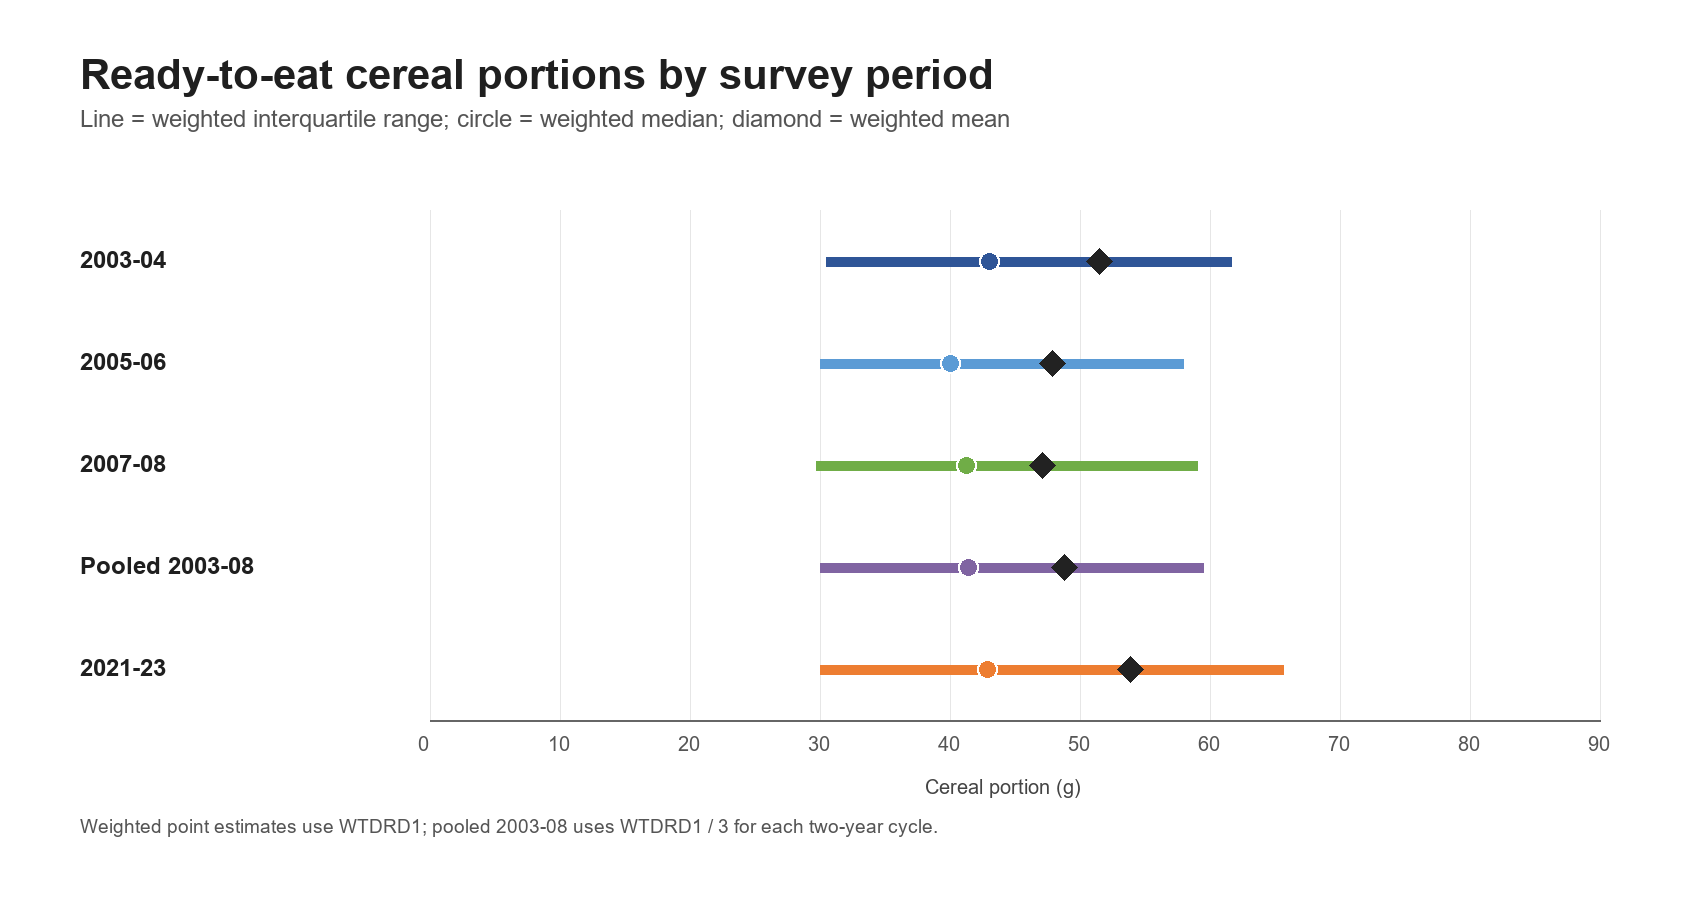
The survey-weighted mean ready-to-eat cereal portion increased from 48.8g to 53.9g. The median moved much less, from 41.4g to 42.9g.
The evidence points to growth among larger portions rather than a wholesale shift in the centre of the distribution.
Finding: between pooled 2003–08 and 2021–23, the weighted mean portion increased by 5.1g (10.4%). The approximate design-based 95% interval for that increase is 2.0g to 8.2g. The weighted median increased by only 1.5g.
What we examined
We extracted ready-to-eat cereal eating occasions from the Day 1 NHANES/WWEIA Individual Foods files for 2003–04, 2005–06, 2007–08 and August 2021–August 2023. The analysis includes respondents aged 4 or older with a reliable recall and a positive Day 1 dietary weight.
Each reported cereal amount was aggregated to its eating occasion. Survey estimates use the NHANES Day 1 dietary weight and the masked stratum and primary sampling-unit variables. The pooled 2003–08 weight is each two-year weight divided by three.
Results by survey period
| Period | Respondents | Cereal occasions | Weighted mean | Weighted median | Middle 50% |
|---|---|---|---|---|---|
| 2003–04 | 1,998 | 2,139 | 51.5g | 43.0g | 30.5–61.6g |
| 2005–06 | 2,204 | 2,345 | 47.9g | 40.0g | 30.0–58.0g |
| 2007–08 | 2,078 | 2,188 | 47.1g | 41.3g | 29.8–59.1g |
| Pooled 2003–08 | 6,280 | 6,672 | 48.8g | 41.4g | 30.0–59.5g |
| 2021–23 | 1,201 | 1,256 | 53.9g | 42.9g | 30.0–65.6g |
The typical portion moved less than the upper tail
The most common practical 10g range remained 30g to less than 40g in every period. The 25th percentile was also effectively unchanged at about 30g.
The larger movement occurred toward the top of the distribution. The 75th percentile increased from 59.5g in pooled 2003–08 to 65.6g in 2021–23. That helps explain why the mean rose by more than the median.
Where 40g, 70g and 90g sit in the latest data
The original version of this article used 40g, 70g and 90g only as illustrative quantities. The latest survey distribution now gives those examples context.
| Quantity | Multiplier versus 40g | Weighted share of 2021–23 occasions at or above |
|---|---|---|
| 40g | 1.00× | 56.4% |
| 70g | 1.75× | 23.5% |
| 90g | 2.25× | 13.5% |
These are weighted descriptive point estimates, not claims that any amount is advisable. A 70g or 90g portion is a minority of reported occasions, but it is not outside the observed distribution.
If an illustrative 40g label serving contains 150 kcal, the same cereal contains about 263 kcal at 70g and about 338 kcal at 90g. Nutrition values scale with weight; the product data per gram does not change.
Why this is not a direct FDA RACC test
FDA reference amounts for ready-to-eat cereal depend on cereal density. This analysis deliberately combines different densities to describe the overall reported distribution. A pooled median near 40g therefore cannot establish that 40g is the correct regulatory or label serving for a particular cereal.
FDA's serving-size work also considered two recall days and density-specific categories. This analysis uses Day 1 only. A product-level judgement still requires the exact product, its density category, the applicable regulation and its declared serving.
What this does not say about obesity
Adult obesity increased over the same broad period, but parallel trends do not show that cereal portions caused that increase. BMI reflects years of energy balance; this analysis describes one reported food on one recall day and includes children as well as adults. Milk, toppings, second helpings, physical activity and earlier dietary history are outside the comparison.
Limitations
- One recall day estimates population averages, not an individual's usual cereal intake.
- Dietary recall is self-reported and subject to portion-estimation error and under-reporting.
- The 2021–23 collection mode and pandemic-era context differ from earlier cycles.
- FNDDS codes and recipes change between releases.
- The primary classification includes stable ready-to-eat cereal code families 571–574 and one latest code explicitly described as ready-to-eat; ambiguous cereal-not-further-specified records were excluded.
- Cereals differ in density, shape and nutrient composition.
- Bowls do not provide a reliable weight without measurement.
- Milk, toppings and second servings are outside this calculation.
Why the information may be useful
The results show both a statistically supported increase in the mean and much greater stability in the median and modal range. That distinction matters: one number cannot describe the whole portion distribution.
For a specific product, weigh the selected amount, divide it by the label serving and multiply each nutrition value by that result. The calculation is useful, but it should remain separate from claims about what Americans typically consume.
Method and sources
The analysis uses the NHANES/WWEIA Individual Foods, Demographics and Dietary Interview Technical Support files for 2003–04, 2005–06, 2007–08 and August 2021–August 2023. The first digit and reviewed cereal subfamilies of the FNDDS food code were used to identify ready-to-eat cereal records.
See the latest NHANES dietary data release, the FNDDS 2021–2023 documentation and the downloadable PerBiscuit summary CSV. Product rescaling still follows the portion rescaling method.
Last reviewed and corrections
This analysis was last reviewed on July 23, 2026. Independent scientific review remains pending. Please use the corrections process if the arithmetic, classification or interpretation needs attention.
Try your own amount
Compare a selected portion
Search for a product, check the source and move the slider to the quantity you want to examine.
Compare a portion